Developers Documentation
Building from source
Linux (Ubuntu)
sudo apt install clang-11 libclang-11-dev llvm-11-tools llvm-11-dev
sudo -H pip install lit
git clone https://github.com/vgvassilev/clad.git clad
mkdir build_dir inst; cd build_dir
cmake ../clad -DClang_DIR=/usr/lib/llvm-11 -DLLVM_DIR=/usr/lib/llvm-11 -DCMAKE_INSTALL_PREFIX=../inst -DCMAKE_BUILD_TYPE=Debug -DLLVM_EXTERNAL_LIT="``which lit``"
make && make install
Instructions to build documentation
Make sure you have installed sphinx before building clad with documentation.
Please use the project’s requirements.txt file to install Python dependencies. This will also install the correct version of sphinx :
pip install -r requirements.txt
Make sure doxygen is installed if you want to build the internal documentation :
Doxygen Installation Instructions.
To build clad and its documentation, use the following CMake command:
cmake ../clad -DClang_DIR=/usr/lib/llvm-11 -DLLVM_DIR=/usr/lib/llvm-11 -DCLAD_INCLUDE_DOCS=ON -DCLAD_ENABLE_DOXYGEN=ON -DCLAD_ENABLE_SPHINX=ON -DCMAKE_INSTALL_PREFIX=../inst -DCMAKE_BUILD_TYPE=Debug -DLLVM_EXTERNAL_LIT="``which lit``"
make sphinx-clad doxygen-clad
The built user documentation can be found in build/docs/userDocs/build; while the built internal documentation can be found in build/docs/internalDocs/build.
Developers Environment (Linux) - debug build of LLVM, Clang and Clad from source
Clad is a plugin for LLVM Clang compiler infrastructure. Clad uses Clang and LLVM APIs. Therefore, to properly debug Clad, you will also need a debug build of LLVM.
Please visit LLVM CMake documentation
to learn how to build LLVM from source. Make sure to pass -DCMAKE_BUILD_TYPE=Debug
and -DLLVM_ENABLE_PROJECTS="clang" options to LLVM CMake configure command.
In brief, debug build of LLVM with Clang enabled can be built using the following instructions:
python -m pip install lit
git clone https://github.com/llvm/llvm-project.git
cd llvm-project
git checkout llvmorg-16.0.0
Build Clang:
mkdir build && cd build
cmake -DLLVM_ENABLE_PROJECTS="clang" -DCMAKE_BUILD_TYPE="DEBUG" -DLLVM_TARGETS_TO_BUILD=host -DLLVM_INSTALL_UTILS=ON ../llvm
cmake --build . --target clang --parallel $(nproc --all)
make -j8 check-clang # this installs llvm-config required by lit
cd ../..
Clone and build Clad:
git clone https://github.com/vgvassilev/clad.git
cd clad
mkdir build && cd build
cmake -DLLVM_DIR=PATH/TO/llvm-project/build -DCMAKE_BUILD_TYPE=DEBUG -DLLVM_EXTERNAL_LIT="$(which lit)" ../
make -j8 clad
Please note that it is recommended to have at least 16 GB of total memory (RAM + swap) to build LLVM in debug mode.
To build Clad with Debug build of LLVM, adjust the -DClang_DIR and
-DLLVM_DIR options to point to installation home of debug build of LLVM.
If you are low on computational resources, the following tweaks may help to reduce build times, and use less storage and memory consumption while building LLVM.
Use Ninja build system instead of make. For large codebases, ninja performs significantly better than GNU make.
Use ‘gold’ linker instead of the default BFD ‘ld’ linker. The gold linker was written to make the link process considerably faster. It also consumes less memory.
Build LLVM as a shared library. By default, each component is built as a static library. Linking against a static library usually takes more time. And also if multiple executables link against the same set of static libraries then the total size of these executables will be significantly larger.
Split the debug info. This option reduces link-time memory usage by reducing the amount of debug information that the linker needs to resolve.
Build an optimised version of llvm-tblgen.
After incorporating all of these tweaks, the CMake command should look like this:
cmake -G Ninja /path/to/llvm-project/llvm -DLLVM_USE_LINKER=gold -DCMAKE_BUILD_TYPE=Debug -DLLVM_TARGETS_TO_BUILD=host -DBUILD_SHARED_LIBS=On -DLLVM_USE_SPLIT_DWARF=On -DLLVM_OPTIMIZED_TABLEGEN=On -DLLVM_ENABLE_PROJECTS=clang -DCMAKE_INSTALL_PREFIX=../inst
Clad Internal Documentation
Clad maintains an internal Doxygen documentation of its components. Internal documentation aims to capture intrinsic details and overall usage of code components. The goal of internal documentation is to make the codebase easier to understand for the new developers.
Internal documentation can be visited here
In case you are interested in seeing the big picture and are just getting started with Clang, there is a document that might help you: Introduction to Clang for Clad contributors. It covers most of the basic concepts in Clang that Clad uses and describes the operation of the latter with examples for newcomers specifically.
Clad’s Tests
Clad uses LLVM’s testing infrastructure.
Here is extensive information
about the lit testing infrastructure in LLVM. The tests are located in the
folder test and unittest. The test folder contains lit-based tests
which check the execution result and the produced code. The unittest folder
contains GoogleTest-based tests which are compiled.
The tests can be run with:
cmake --build . --target check-clad
When developing a feature sometimes fixing all the outputs of the tests to see if the feature does not break the execution of the programs is too laborious. For such cases we can run only the execution result checks and ignore temporarily the differences in the produced outputs with:
cmake --build . --target check-clad-execonly
Debugging Clang
Why debug the Clang compiler?
Given a function fn and argument information, Clad generates the source code
of a function that computes derivatives of fn with respect to specified
input arguments. It is not always easy to find the right way to build a required
C++ code without having a deeper understanding of how Clang would build that code.
Thus, a typical workflow in Clad involves understanding how Clang builds
a particular C++ code and exactly which Clang APIs are involved in building it.
Debugging the Clang compiler allows us to see in-action and give insights into how Clang
builds a given C++ code.
Debugging Clang during compilation
To study how Clang processes a C++ code, we can debug the Clang compiler while it is compiling a source code.
Before proceeding, make sure you have compiled clang in debug mode so that proper debug symbols are available.
We need to debug the Clang compiler when it’s compiling a source code. One important thing to note here is, that we need to debug clang compiler rather than clang driver.
When we run command such as:
clang++ -g hello-world.cpp
This command executes the Clang driver. Clang driver invokes preprocessor, compiler, assembler,
and linker as needed along with all the necessary flags. Clang driver drives the compilation process.
We cannot directly debug clang++ executable since it’s the driver and not the compiler itself.
Generally, the compiler driver creates a fork for the compiler.
GDB has set follow-fork-mode child option that can be used to debug the compiler.
Alternatively, you can find and debug the compiler invocation that is used by the driver
as part of the compilation pipeline of a program. The Clang driver invokes the clang
compiler with all the necessary arguments. Compiler invocation command can be obtained
by adding the -v option to the Clang driver command.
For example,
clang++ -g hello-world.cpp -fsyntax-only -v
This command will give output similar to
Ubuntu clang version 11.1.0-6
Target: x86_64-pc-linux-gnu
Thread model: posix
InstalledDir: /home/parth/Programs/bin
Found candidate GCC installation: /usr/lib/gcc/x86_64-linux-gnu/11
Selected GCC installation: /usr/lib/gcc/x86_64-linux-gnu/11
Candidate multilib: .;@m64
Selected multilib: .;@m64
 (in-process)
 "/usr/lib/llvm-11/bin/clang" -cc1 -triple x86_64-pc-linux-gnu
 -fsyntax-only -disable-free -disable-llvm-verifier -discard-value-names
 -main-file-name hello-world.cpp -mrelocation-model static
 -mframe-pointer=all -fmath-errno -fno-rounding-math -mconstructor-aliases
 -munwind-tables -target-cpu x86-64 -fno-split-dwarf-inlining
 -debug-info-kind=limited -dwarf-version=4 -debugger-tuning=gdb
 -v -resource-dir /usr/lib/llvm-11/lib/clang/11.1.0
 -internal-isystem /usr/lib/gcc/x86_64-linux-gnu/11/../../../../include/c++/11
 -internal-isystem /usr/lib/gcc/x86_64-linux-gnu/11/../../../../include/x86_64-linux-gnu/c++/11
 -internal-isystem /usr/lib/gcc/x86_64-linux-gnu/11/../../../../include/x86_64-linux-gnu/c++/11
 -internal-isystem /usr/lib/gcc/x86_64-linux-gnu/11/../../../../include/c++/11/backward
 -internal-isystem /usr/local/include -internal-isystem /usr/lib/llvm-11/lib/clang/11.1.0/include
 -internal-externc-isystem /usr/include/x86_64-linux-gnu -internal-externc-isystem /include
 -internal-externc-isystem /usr/include -fdeprecated-macro -fdebug-compilation-dir /home/parth
 -ferror-limit 19 -fgnuc-version=4.2.1 -fcxx-exceptions -fexceptions -faddrsig -x c++ hello-world.cpp

clang -cc1 version 11.1.0 based upon LLVM 11.1.0 default target x86_64-pc-linux-gnu
ignoring nonexistent directory "/include"
ignoring duplicate directory "/usr/lib/gcc/x86_64-linux-gnu/11/../../../../include/x86_64-linux-gnu/c++/11"
#include "..." search starts here:
#include <...> search starts here:
 /usr/lib/gcc/x86_64-linux-gnu/11/../../../../include/c++/11
 /usr/lib/gcc/x86_64-linux-gnu/11/../../../../include/x86_64-linux-gnu/c++/11
 /usr/lib/gcc/x86_64-linux-gnu/11/../../../../include/c++/11/backward
 /usr/local/include
 /usr/lib/llvm-11/lib/clang/11.1.0/include
 /usr/include/x86_64-linux-gnu
 /usr/include
End of search list.
With the compiler invocation command in hand, we are ready to debug the compiler.
A typical example that demonstrates debugging of a program using lldb
lldb clang
# set breakpoints
breakpoint set -n "clang::Sema::BuildDeclRefExpr"
process launch -- {compiler-invocation-arguments}
Replace {compiler-invocation-arguments} with the compiler invocation arguments
obtained by executing the Clang driver command with -v option.
Debugging Github runners
GitHub runners build and test Clad on a combination of different build compilers, Clang runtimes and Operating systems (Mac and Ubuntu). It gets difficult to debug Clad if one or a few of the GitHub runners are failing, but everything seems to work fine on the local system. To debug failing tests, it will be necessary to replicate the GitHub runner environment on which tests are failing just to reproduce the bug, and sometimes it may not be even feasible to replicate the GitHub runner environment.
For cases like these, we can directly ssh into the Github runner and debug the codebase there itself, thus saving a lot of time in replicating the Github runner environment.
To ssh into the GitHub runner on which tests are failing, click on re-run actions
and select the debug logging checkbox. If necessary increase the value of
timeout-minutes key in .github/workflows/ci.yml to a suitable value for
debugging – 30 - 60 minutes should generally be enough.
After increasing the timeout minutes value, committing and pushing the change.
GitHub runners that have failing tests will stay active for the time specified for
the timeout-minutes. To ssh into a
GitHub runner, go to the latest GitHub action corresponding to the push event,
select any Github runner with failed checks, and click on the
setup tmate session drop-down to display ssh connection details of the selected
Github runner.
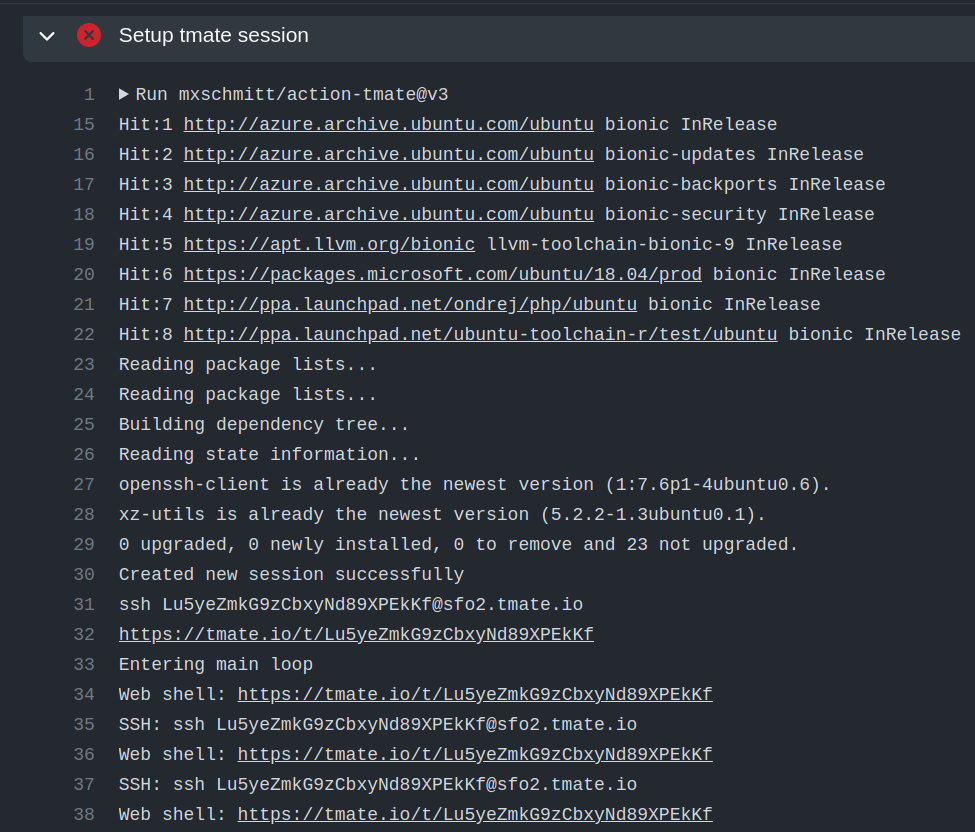
Now, to ssh into the GitHub runner do, simply do:
ssh SSH_KEY
No username or password is required.
Please note that there are some specifics of debugging the “Architecture” check. If you need to build Clad after logging into this particular GitHub runner (the one performing the “Arch / architecture (x86)” check), please perform the following steps first.
In the debug output on GitHub (typically displayed in purple), find the line:
/home/runner/rootfs/alpine-edge-x86/abin/alpine.sh /home/runner/work/_temp/%UNIQUE_FILENAME%
Copy the name of the second file in that line (everything after the spacebar) and do:
bash
vim /home/runner/work/_temp/%UNIQUE_FILENAME%
So you need to switch to bash to have access to some text editors and then inside Vim (or any other editor you find there, you can even use cat for this), you need to edit the contents of this file to only contain the following:
export CC=/usr/bin/clang-17
export CXX=/usr/bin/clang++-17
sh
Basically, you need to replace the last several lines with just sh. Now do,
/home/runner/rootfs/alpine-edge-x86/abin/alpine.sh /home/runner/work/_temp/%UNIQUE_FILENAME%
After this you’re able to do cd build && make check-clad and build Clad on that runner.
Debugging x86 builds locally
It is possible to use a local namespace container using systemd-nspawn.
In order to replicate the CI environment as closely as possible it is recommended to use
an Alpine mini root filesystem, which can be downloaded from Alpine Downloads.
After downloading, the container can be set up in the ~/alpine32/ directory with the
following commands:
mkdir ~/alpine32/
tar -C ~/alpine32/ -xpf alpine-minirootfs-*.tar.gz
A shell inside the container can be created with:
sudo systemd-nspawn --personality=x86 -D ~/alpine32/
When in the container the neccessary tools can be installed with:
apk add llvm llvm-dev llvm-gtest llvm-static clang clang-dev clang-static make cmake git
Then clad can be built:
git clone https://github.com/vgvassilev/clad.git
cd clad/
mkdir build/ && cd build/
cmake -DLLVM_EXTERNAL_LIT="$(which lit)" ../
make -j$(nproc --all) clad
If debugging it could be useful to add -DCMAKE_BUILD_TYPE=Debug to the cmake command
and specifying the check-clad target when running make in order to also run the tests.
Note: LLDB can’t run any processes on x86 [1], but GDB can be used instead.
